Transcode ladder cost per rung, skip the upscale
Compare the cost of each rung in a 1080p to 240p transcode ladder. On a 720p source the 1080p rung took 4x the encode time of 720p and added no detail.
 Abdelrahman Essawy 4 MIN READ
On a 720p source, the 1080p rung of a transcode ladder is an upscale. It took 4x the encode time of the 720p rung and wrote 2.3x the bytes, for no detail the 720p rung did not already have. Cap the ladder at the source resolution and that rung disappears, which is the largest single saving in the sweep below.
Each rung is the same libx264 command at CRF 23 with a different scale width, run on the 720p clip every benchmark here uses. Its details and the timing rules are on the shared benchmark setup.
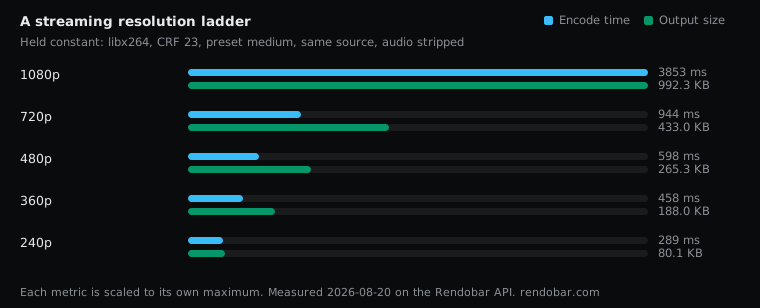
| Variant | Encode | Size | Cost |
|---|---|---|---|
| 1080p | 3853 ms | 992.3 KB | $0.0063 |
| 720p | 944 ms | 433.0 KB | $0.0023 |
| 480p | 598 ms | 265.3 KB | $0.0027 |
| 360p | 458 ms | 188.0 KB | $0.0023 |
| 240p | 289 ms fastest | 80.1 KB | $0.0017 |
The top rung carries the ladder
The 1080p rung took 63% of the ladder’s total encode time on this run. Against the 720p rung it was 4.1x slower, far enough past the 2x noise threshold to be a finding from one sample.
Against the four lower rungs combined it was 1.7x. That is under 2x from single samples, so the fair reading is that the top rung costs about as much as the rest of the ladder put together, possibly more. It also took longer than its pixel count alone predicts (2.25x the pixels of 720p), but with one sample I would not read anything into the excess.
The lower rungs fall with pixel count
Each rung below 720p has 1.8x to 2.25x fewer pixels than the one above. Bytes fell 1.4x to 2.3x per rung and encode time fell 1.3x to 1.6x. The per-rung time steps are all under 2x from single samples, so the solid statement is the overall one: 240p encoded about 3.3x faster than 720p and wrote 18% of its bytes.
It is also the answer when someone proposes dropping the low rungs to save money. They are not where the money goes. They are what keeps a stream playing on a bad connection.
Cap the ladder at the source
The trap is a fixed ladder pointed at whatever arrives. Uploads come in every resolution, and every 720p one silently pays for a 1080p rung that cannot improve on it.
force_original_aspect_ratio does not prevent this. It fits the frame inside the box you give it, so scale=1920:1080:force_original_aspect_ratio=decrease turns a 1280x720 source into 1920x1080. To scale down but never up, cap the height with an expression:
# Never upscale: the output height is the smaller of 1080 and the input heightffmpeg -i in.mp4 -vf "scale=-2:'min(1080,ih)'" -c:v libx264 -crf 23 out.mp4On a 720p input that writes a 720p file. In a ladder that means the 1080p rung now duplicates the 720p one, so the better fix is to read the height first and skip every rung above it:
ffprobe -v error -select_streams v:0 -show_entries stream=height -of csv=p=0 in.mp4That prints a bare number such as 720. Build the ladder from the rungs at or below it. Reading dimensions and duration back out of a file covers the other fields worth checking at the same time.
What the whole ladder cost
The five rungs together wrote 4.5x the bytes of the 720p rung alone. That multiple is exact, because sizes do not move between runs.
The billed cost is less certain. The ladder billed $0.0154 in total, 6.8x the lone 720p job, and the 1080p rung was 41% of it. But the 720p job billed at the bottom of the range identical work has cost. At the top of that range the multiple would be closer to 4x. Plan on the byte multiple, and treat the cost multiple as somewhere between those two.
This sweep used a flat CRF on every rung. A production ladder caps each rung’s bitrate, which changes the size column but not where the encode time goes. CRF against target bitrate measures that trade, and the x264 preset sweep covers the preset that sets each rung’s speed.
Every rung was an independent API call, and a production ladder can run the same way. The rungs do not depend on each other, so they can run in parallel and the ladder finishes when its slowest rung does.
I would probe every input and drop the rungs above its height before encoding anything. On a library of mixed uploads that one check removes the most expensive rung from every file that never had the detail to fill it.