Live machine metrics on every job
Watch live CPU, memory, and network use while a job runs, replay the graph after it finishes, and read the series from the API.
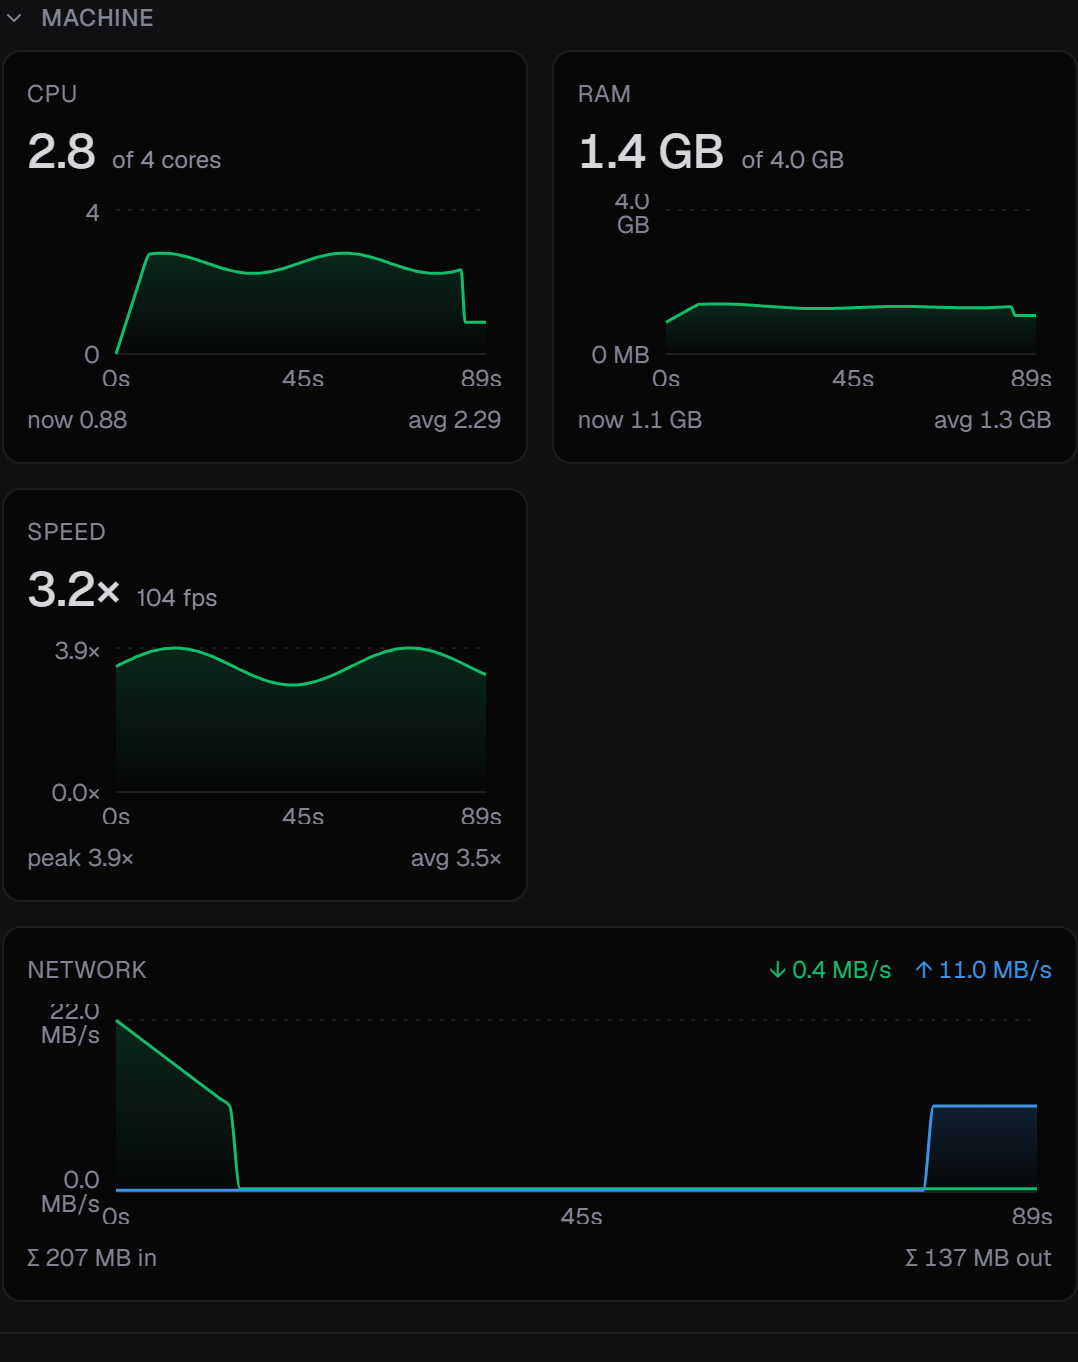
Every job now shows what its machine is doing while it runs. The job detail page has a Machine panel with live CPU, memory, and network usage that updates once a second. After a job finishes, the same graph replays from a saved series, so you can see how a run behaved after the fact.
On the API
The numbers are on the API too. GET /jobs/:id/metrics returns the recorded series for a job, and the same samples stream live over the realtime WebSocket as job.metrics events. The SDK exposes them through onMetrics, so an agent can watch a run the way the dashboard does.
- CPU shows as a percent of the machine and as cores in use, like 5.5 of 8 cores.
- Memory is the container’s RAM, measured against its limit.
- Network shows download and upload throughput each second.
- The playground console has a compact live strip with the same numbers while a job runs.
Metric events ride the realtime stream described in job lifecycle. The panel that renders them was later rebuilt, see encode speed in the Machine panel.