Encode speed and right-size hints in the Machine panel
The job Machine panel was redesigned. It now shows live encode speed and fps, peak and average for each metric, total data moved, and a hint when a job used far less CPU than its machine.
The Machine panel on the job detail page got a redesign. Each metric is now a card with the current value, a filled trend line, and the peak and average for the run. CPU, memory, and the network card shift from green to amber to red as they near their limits, so a hot job is obvious at a glance.
Encode speed
While a job runs, a Speed card shows how fast it is encoding relative to real time, along with the current frames per second. A job encoding at 2.3 times real time shows as 2.3x. The panel also flags when a run peaked well under its allotted CPU, so you know you can move it to a smaller machine next time.
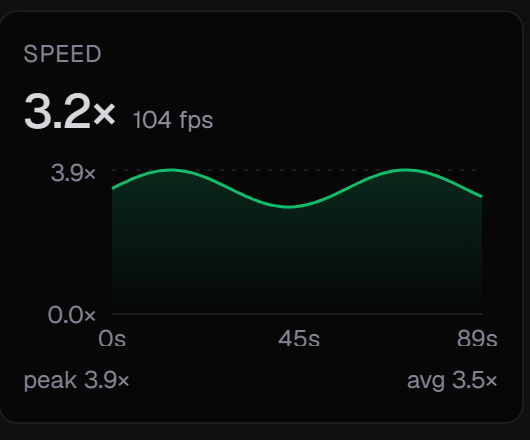
- CPU, RAM, and Speed each show value, trend, peak, and average.
- The network card shows download and upload together, plus the total moved over the run.
- A live or final badge shows elapsed time, and cost once the job settles.
- The playground console footer carries the same numbers, now with status colors.
The series behind the cards is the one added in live machine metrics. Job states are documented in job lifecycle.